
CattleXpert.
Connected livestock data.
Clearer operational views.
Anviam worked on CattleXpert's web application with Node.js/Next.js, React and PostgreSQL, connecting analytical dashboards and custom filters with IoT-driven information.
From connected data
to operational insight.
- Node.js / Next.js
- React web
- PostgreSQL data
- Dashboards & IoT
Conceptual workflow illustration · Not a product screenshot
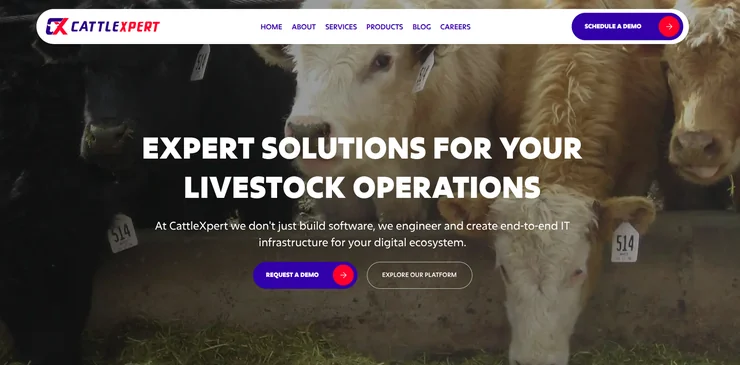
From Connected Records to Useful Livestock Analysis
- The productA web experience within a livestock-management environment.
- Anviam's contributionNode.js/Next.js, React, PostgreSQL, dashboards, filters and IoT.
- The purposeMake connected operational information easier to explore.
Livestock Information Connected to a Clearer Web Experience
Anviam worked on CattleXpert using Node.js/Next.js, React and PostgreSQL. The contribution covers analytical dashboards, custom filters and a web application connected with IoT.
Product Context
CattleXpert publicly presents feedlot and livestock-management software. Its broader product suite provides domain context; not every current module is attributed to Anviam's engagement.
Users and Decisions
Operational teams need to find relevant animal, lot and device information without confusing missing data with a normal reading. Managers need analytical views with clear definitions and filter scope.
Making Connected Livestock Data Useful for Operations
Engineering requirements relevant to the delivery scope, not a reconstructed history of incidents.
Consistent Record Context
Animal, lot, pen and device references need a coherent relationship. A valid reading linked to the wrong operational record can produce a misleading view.
Filters With Understandable Scope
Users need to know which records, dates and conditions are included. Multiple filters should behave consistently across tables, charts and dashboard totals.
Device Data With Freshness Context
IoT events may arrive late or be absent. The interface should distinguish current, stale and missing information rather than treating all values as equally recent.
Analytical Clarity
Dashboard labels, units and aggregation rules need explicit definitions. A visual trend should not imply an operational or financial outcome that has not been measured.
Web, Analytics and IoT Connectivity
The technology and functional scope below was supplied directly for this case study.
Node.js / Next.js Application Work
Application work on the Node.js and Next.js stack, covering the services behind the web experience.
React Web Interfaces
Readable analytical views, clear states and consistent interactions in the web application.
PostgreSQL Data Layer
PostgreSQL within the application stack, holding the records behind dashboards and filters.
Dashboards, Filters and IoT
Analytical dashboard and custom-filter work alongside web-to-IoT connectivity.
Operational Livestock Context With Focused Analytical Tools
Anviam's dashboard, filter and integration work is shown separately from the wider public product suite.
Delivered by Anviam
- Analytical dashboards in the web application
- Custom filters to narrow relevant application information
- IoT-connected web application, linking device data to the web workflow
The Wider CattleXpert Suite
- Individual and group animal tracking with operational records
- Cattle movement, pen and lot management, and inventory
- Feeding, processing and animal-health workflows
- Reporting, cost analysis and projections
- Integrations with RFID, scales, sensors and other systems
- Modular tools such as ArrivalXpert and VetXpert
Public suite capabilities give domain context and are not claimed as Anviam's delivery scope.
Connect the Data. Filter the View. Review the Operation.
A conceptual web-analysis journey based on the dashboard, filter and IoT scope.
Establish the context
Identify the records, site or operational area relevant to the task.
Receive connected data
Bring available IoT information into the web workflow through the configured integration.
Check identity and freshness
Confirm the reading belongs to the intended record and when it was captured.
Open the dashboard
Review the available summaries and underlying context.
Apply custom filters
Narrow the view using the supported filter conditions.
Inspect the records
Review the details needed to understand the filtered information.
Compare with source context
Check units, dates and missing values before interpreting a pattern.
Coordinate the next step
Use the information within the team workflow; no automated physical action is assumed.
Revisit after updates
Review refreshed information and tell pending updates apart from accepted data.
Web Analytics and IoT With Clear Data Boundaries
Relevant engineering considerations for the delivery stack, rather than an independently inspected architecture.
Device-to-record mapping
Define how device identifiers relate to the correct operational records, and plan handling for reassigned devices and incomplete mappings.
Event timing and deduplication
Preserve capture and receipt timestamps. Define how duplicate, delayed and out-of-order readings affect the published view.
PostgreSQL query requirements
Plan relationships, indexing and aggregation against actual filters and dashboard workloads. No scale or latency guarantee is asserted.
Filter consistency
Keep filter interpretation and reset behaviour coherent across the interface and server-side queries. Show active scope and valid empty-result states.
React dashboard presentation
Make units, time windows and status clear. Separate zero values from missing readings and communicate loading or error states.
Node.js / Next.js integration
Define request validation, error handling and access boundaries between data services and the web interface.
A Connected Web Foundation for Livestock Analysis
The confirmed contribution spans application technologies, analytical dashboards, custom filters and IoT connectivity.
Useful measures include mapping errors, data freshness, duplicate readings, query latency and filter correctness. No weight-gain, feed-saving, animal-health, uptime or profitability result is claimed.
Focused Operational Visibility
The work connects relevant web information with analytical interactions and device data, within the context of livestock operations.
Operational Records, Device Access and Data Privacy
Requirements depend on the data, region and actual deployment. No independent audit or regulatory certification is asserted.
Operational and Customer Data
Assess owner, employee, customer and contact information for privacy and confidentiality, with defined purposes, access and retention.
Device and Integration Access
Review device identity, credentials and provider access. Specific authentication or encryption was not audited.
Traceability and Record Integrity
Preserve source, record and timestamp context where required. Software records alone do not prove compliance with every food-chain obligation.
Animal-Health Information Boundaries
The broader product includes treatment context. This case study does not claim veterinary diagnosis, treatment validation or regulatory approval.
Dashboard and Filter Permissions
A custom filter does not itself establish organisation separation or secure record permissions; access is assessed beyond the visible UI.
Data Lifecycle and Recovery
Define retention, deletion, provider responsibilities and recoverability for operational and telemetry data.
Why Anviam for Your Livestock Web and IoT Project?
Bring web development, data interactions and connected-device requirements into one product discussion.
Talk Through Your Project- Relevant livestock context: an engagement inside a feedlot and livestock software environment.
- Node.js / Next.js experience for application and service responsibilities.
- React frontend delivery with readable dashboards and meaningful states.
- PostgreSQL application data planned around real dashboard and filter workloads.
- Analytical dashboards with clear summaries, measures and source context.
- Custom filters with consistent query semantics and clear active scope.
- IoT-connected workflows covering device identity, freshness and failure handling.
- Evidence-led acceptance criteria agreed before claiming operational gains.